What do hieroglyphs, flowcharts, road signs, and knowledge graphs have in common? They’re all thinking maps. Humans have been thinking in maps since the very first symbolic communication systems.
While thinking in maps may first bring to mind the idea of cartography, a map does not need to be geographic—it can be any symbolic depiction of the relationship between elements of some physical or mental space, such as themes, objects, or areas.
In the December 2007 edition of Philosophy of Mind, Professor Elisabeth Camp, whose research has focused on forms of thoughts that do not fit standard models, wrote: “Thinking in maps is substantively different from thinking in sentences.”
In this article, we will explore the inception of thinking in maps, from the Lascaux caves to Ancient Egypt, Babylon, and China, all the way to modern information science and knowledge management, with references to great map thinkers such as Leonardo Da Vinci, Isaac Newton and Walt Disney, across philosophy, religion, geography, business, arts, and science. Buckle up for a journey through time and human mind!
A history of thinking in maps
I vividly remember visiting the Lascaux caves in the South of France when I was a child—well, visiting Lascaux II, an exact copy of the Great Hall of the Bulls and the Painted Gallery, as the original caves are closed to the public for conservation. Fortunately, seven year old me didn’t fully comprehend she was visiting a replica, and it felt like travelling in time.
When thinking about these caves, people mostly picture paintings of horses, aurochs, and deers. But Lascaux is home to something I find even more enthralling: one of the oldest known maps in the world. And it is a map of the skies, not the earth. These dots on the walls of Lascaux, which date back to 14,500 BC, represent Orion, Taurus, and the Pleiades.
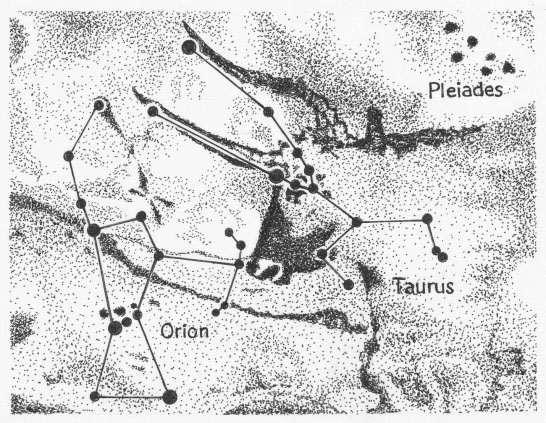
Considering the historical entanglement of the stars with gods and sacred stories—which gave us the names and shapes of most of today’s constellations—the depiction of a star map on the walls of Lascaux is unlikely to have been used as a purely geographical tool.
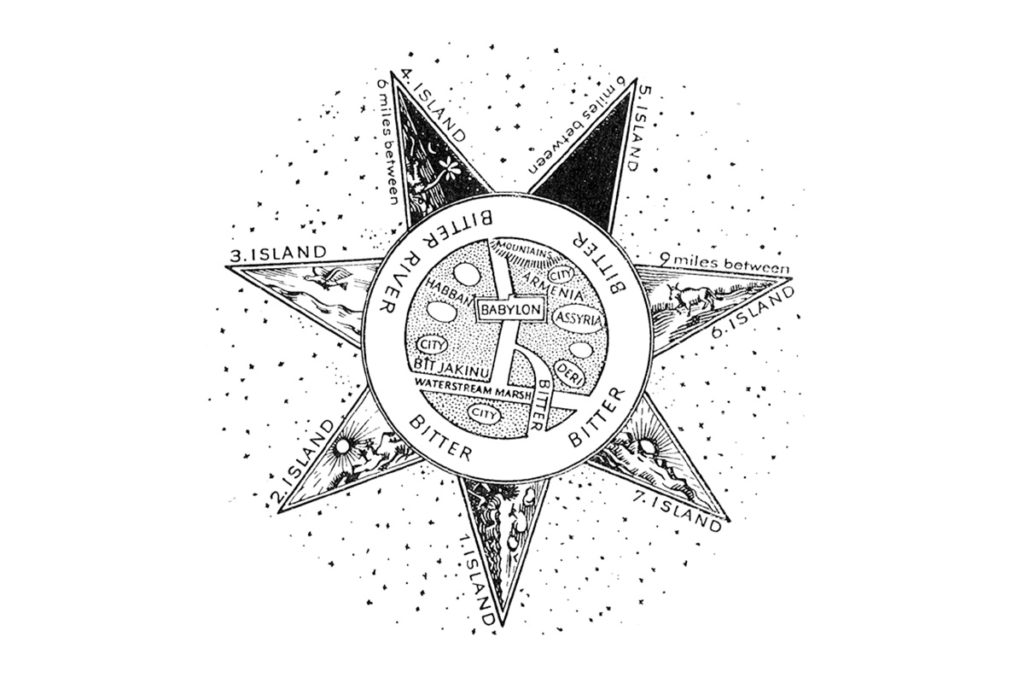
In fact, the oldest surviving map of the world (circa 600 BC) is symbolic, as opposed to literal. Aligned with local religious views of the time, the Babylonian Map of the World depicts the world as a circle surrounded by water, and deliberately omits peoples who were well known to the Babylonians, such as the Egyptians and the Persians.
Of course, purely geographical maps have also played an important role in history. For example, the very few geographical maps that survived from Ancient Egypt show advanced surveying techniques, which may have been developed to re-establish the exact limits of private properties after the annual Nile floods; some evidence suggests the possibility that the Phoenicians knew about the spherical Earth model; and from the Roman Empire to modern times, maps have been used in times of war and peace to devise strategic attacks or to agree on treaties.
But most ancient maps carry a symbolic meaning through the use of figurative geometrical shapes, pictograms, and allegorical devices. While literal cartography (attempting to map the exact contours of the world) is captivating as well, I want to focus on maps as thinking tools—visual devices to capture our mental explorations and expand our minds.
The ancestral mapping of our thoughts and worldview through connected visual symbols which originate from both the physical and the mental world can still be found in our writing systems today.
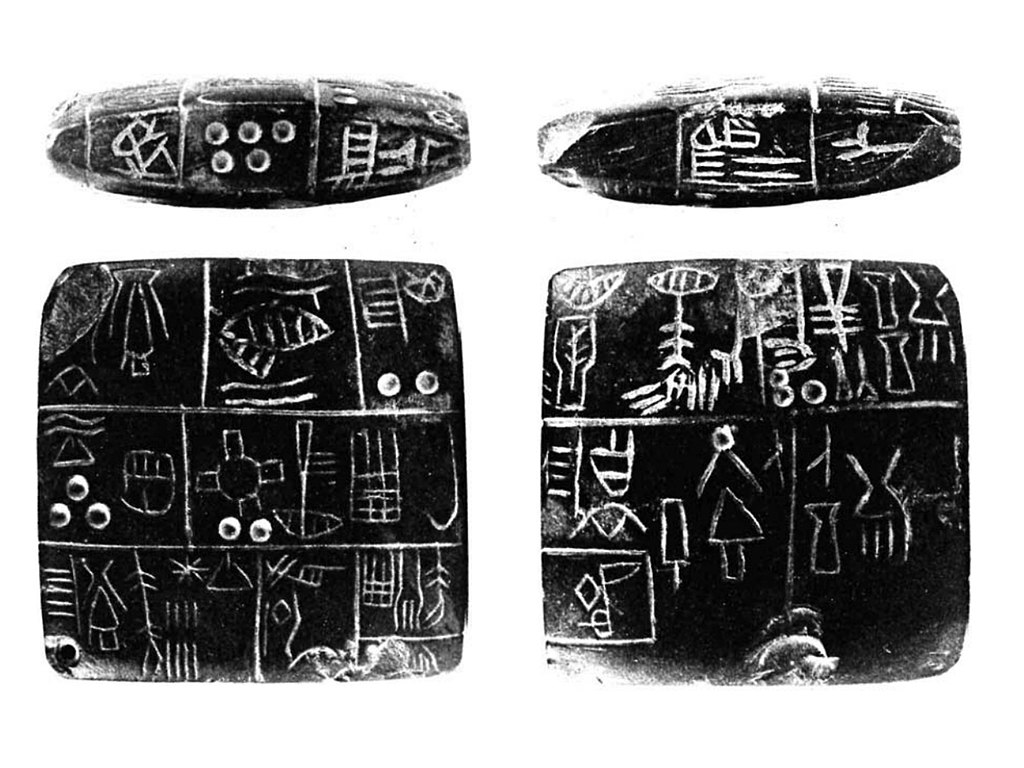
Before humans started using codified alphabets, proto-writing employed connected mnemonic and ideographic symbols to represent rudimentary concepts. Some of the earliest known writing in the world, such as the limestone sumerian Kish tablet from around 3500 BC, depicts pictographic writing where symbols are combined together to create new meanings.
Some scholars think it’s “probable that the general idea of expressing words of a language in writing was brought to Egypt from Sumerian Mesopotamia.” These glyphs, combined together, were used to map one’s thoughts in a visual form that was considered much more than a simple communication tool—scribes were expected to attend the religious and artistic aspects of the hieroglyphs as well.
Over time, some of the Egyptian hieroglyphs started being used as phonograms, whose meaning is determined by pronunciation, independent of visual characteristics. These twenty-four signs (all consonant letters) are believed to have become the inspiration for the original alphabet that was ancestral to nearly all others, including the Latin alphabet.
Common visual symbols:
- Pictogram. A symbol that conveys its meaning through its pictorial resemblance to a physical object.
- Ideogram. A graphic symbol that represents an idea or concept, independent of specific words or phrases.
- Logogram. A written character that represents a word or phrase.
Today, many languages use an alphabetic system (latin, cyrillic, greek, armenian, georgian, hangul), an abjad (similar to the twenty-four ancient Egyptian glyphs, a writing system in which each symbol stands for a consonant, leaving it to the reader to infer the vowels; these include Arabic and Hebrew), or an alphasyllabary (where vowels are denoted by diacritical marks, such as Sanskrit and Thai). However, 1.4 billion people still use a logographic system, where symbols are combined together to create meaning.
For instance, in Chinese, 休 xiū “rest” is composed of 人 rén “person” and 木 mù “tree”. Of course, thousands of years of evolution means that modern Chinese speakers cannot rely on simply deciphering each part of a logogram to guess its meaning. You will find the logogram 每 in the characters 海 “sea”, 侮 “to humiliate”, and 悔 “to regret”—which is not particularly helpful.
Beyond logograms, almost all cultures use pictograms in addition to their written language to communicate meaning. Every road sign is a mini-map using symbolic shapes and colors to connect two or more ideas together and create new meaning. Look around you: laundry symbols, cooking instructions, common software icons—all of these are tiny maps made of connected symbols your mind has been exposed to enough times to interpret automatically.
When thinking in maps, word-maps (pictograms, ideograms, logograms and other visual symbols) are often amalgamated with world-maps (physical or mental space maps) to create visual representations of our knowledge, beliefs, or questions.
“Mightn’t it be a good idea if everyone had to draw a map of his own mind, say, once every five years? With the chief towns marked, and the arterial roads he was constructing from one idea to another, and all the lovely and abandoned by-lanes that he never went down, because the farms they led to were all empty? And arrows showing the directions he wanted to go?” — Charles Williams in The Place of the Lion (1931)
The great map thinkers
Leonardo Da Vinci (1452 – 1519) is probably one of the most famous visual thinkers in history, with about 13,000 pages of notes and drawings combining art and natural philosophy. “These are the principles for the development of a complete mind: study the science of art, study the art of science. Realise that everything connects to everything else,” Da Vinci wrote in one of his notes.
In The Polymath: Unlocking the Power of Human Versatility by Waqās Ahmed, art historian Martin Kemp is quoted remarking: “One of the characteristics you will find of polymaths is that they see links where we see separations—for Leonardo everything is linked up.”
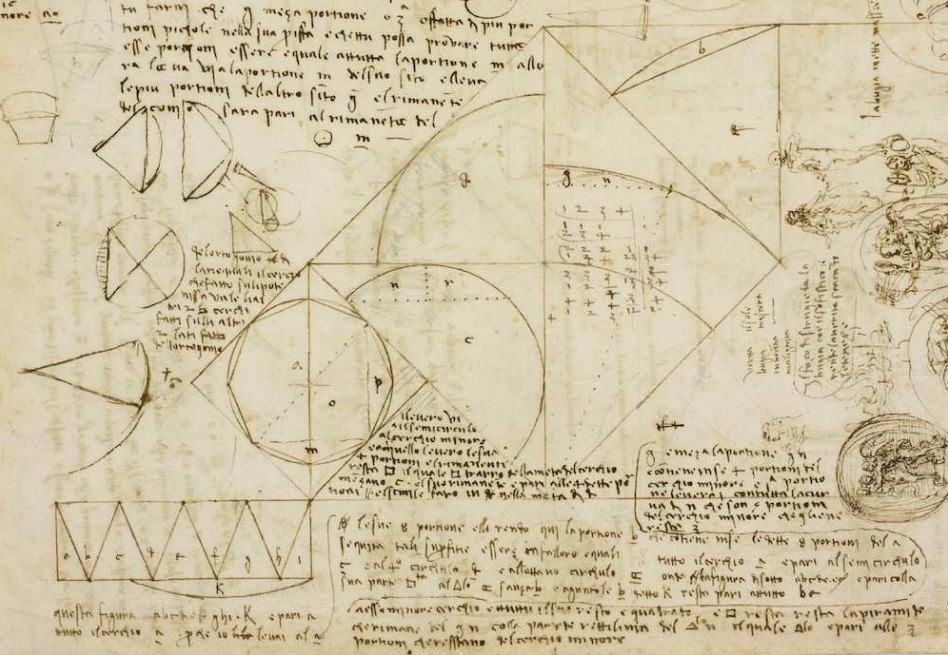
Da Vinci is often credited with being an early user of mind maps. However, while Da Vinci was thinking in maps, as can be seen in the many cross-disciplinary connections he made across visual arts, literature, mathematics, engineering, astronomy, and more—which allowed him to see the interconnectedness of seemingly disparate aspects of the world—there is no evidence (that I know of) of a clear mind map or concept map as drawn by Da Vinci.
Instead, one of the earliest mind maps we know of can be found in the Codex Amiatinus, the oldest surviving example of a complete Bible, which was commissioned as a gift for the Pope in 692. It’s a beautifully simple visual representation of the outline of the Bible. What I find fascinating is that, more than 1,300 years later, the expected flow of thought of this map will feel natural to any modern observer, with the central idea at the top branching out into sub-concepts, like a modern organisational chart.
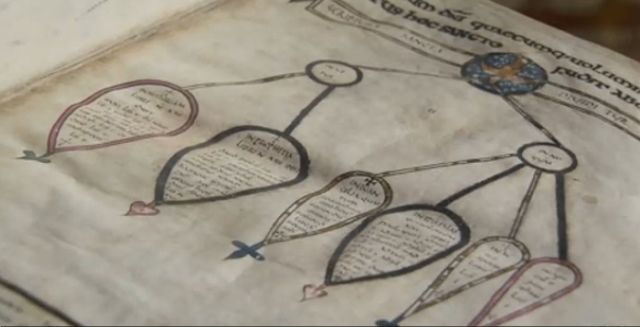
This early mind map was created by Cassiodorus, a Roman author, who is known for integrating such diagrams (or stemmata, trees showing the relationships within a literary work) in his writing. What is remarkable about his diagrams is that Cassiodorus does not use them to illustrate or accompany the text. Instead, the diagrams are the text, analysing elements of rhetorical, philosophical, and mathematical theory by showing how the components interact with each other.
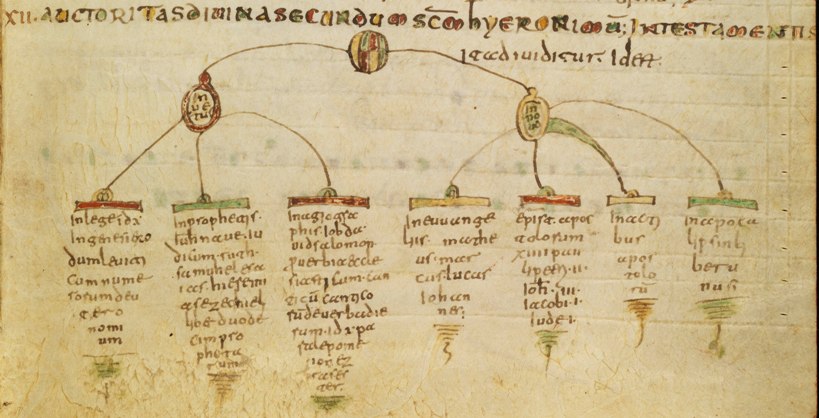
“Cassiodorus is casual in his employment of the stemmata, without any kind of apology or instructions for their use. This strongly suggests that a familiarity with this kind of sketch must have been expected of an intellectually literate person in the Roman world,” reckoned Jean-Baptiste Piggin*, who studied visualisation, late antiquity, and medieval history.
* “[Jean-Baptiste Piggin] was a classic product of the free internet: a man whom nobody would ever have heard of, who decided, by himself, without asking permission of anyone, to do something that he fancied doing, and thereby enriched the lives of thousands,” says a farewell message from a colleague.
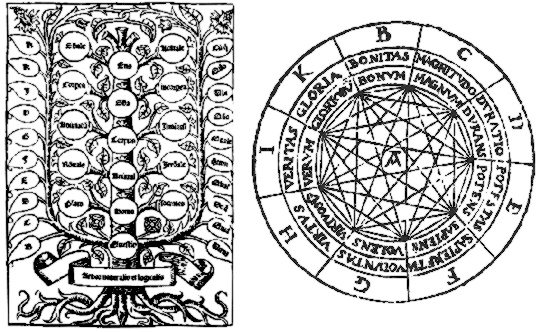
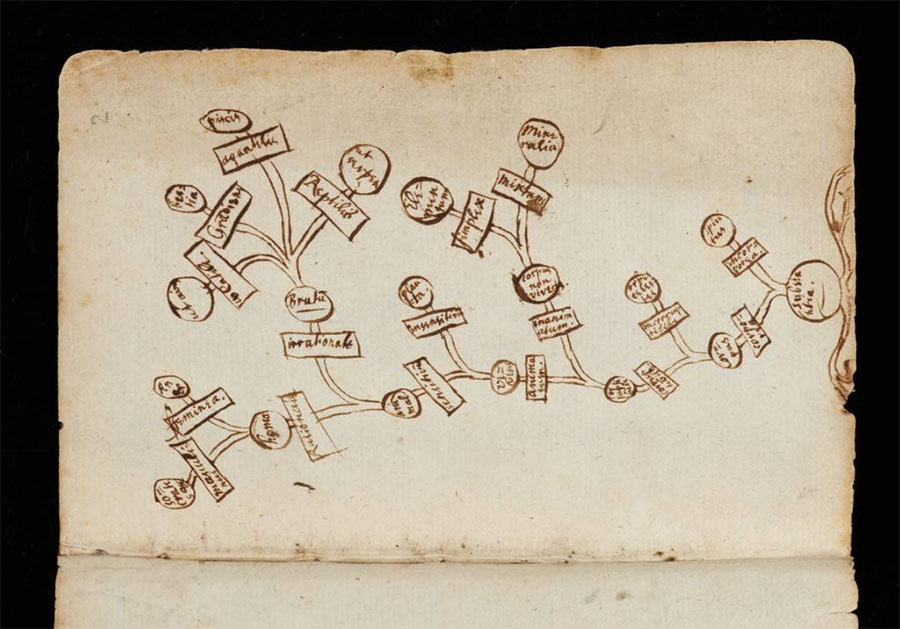
Much later, Ramon Llull (1232 – 1316), a mathematician and philosopher from the Kingdom of Majorca—considered a polymath and a pioneer of computation theory by many historians—was an enthusiastic user of visual maps as a tool for thought. His Tree of Science represents each scientific area by “a tree with roots, trunk, branches, leaves and fruits. The roots represent the basic principles of each science; the trunk is the structure; the branches, the genres; the leaves, the species; and the fruits, the individual.” (Wikipedia)
While many early maps were religious in nature, thinking in maps seems to be common among scientists. Isaac Newton (1643 – 1727) was another great map thinker, using diagrams to explore scientific concepts and research ideas. This example is from his notes kept at the Cambridge University Library.
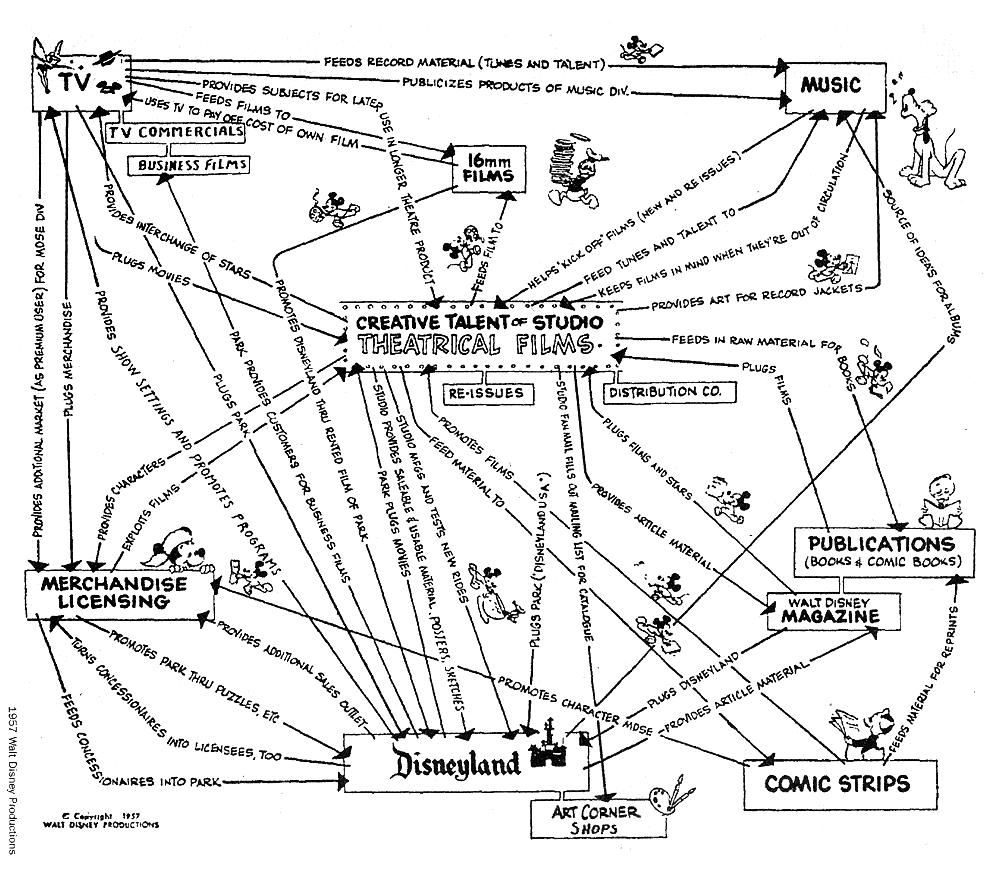
More recently, and outside the scientific realm, this intricate map based on Walt Disney’s vision of the interconnected relationship between his company’s business units was included in an internal presentation by a Disney executive in 1957. What makes this map particularly interesting is its emphasis on dynamic relationships rather than static links.
While I hope this short journey throughout the ages shows that humans have been thinking in maps for millennia, the term “mind map” itself is actually fairly recent. To be exact, it dates from 1974, when it was used by author and educational consultant Tony Buzan in a BBC TV series called Use Your Head. Tony Buzan is often credited as the inventor of the mind map. More accurately, he invented the term mind map.
These days, mind mapping is probably the most well-known visual way to make sense of the world. However, there are many other ways to think in maps.
How to think in maps
Probably because of the natural inspiration from actual trees—see Llull’s Tree of Science earlier in this article, or Darwin’s Tree of Life—mental maps as trees with a trunk and branches seem to be the oldest form of node-link diagrams. However, as the need to visually represent complex ideas evolved, new ways of thinking in maps were devised. Here are just a few types of maps for thought, which differ by the types of nodes, the interlinking rules, the directionality of the links, and the absence or presence of a root node (or trunk).
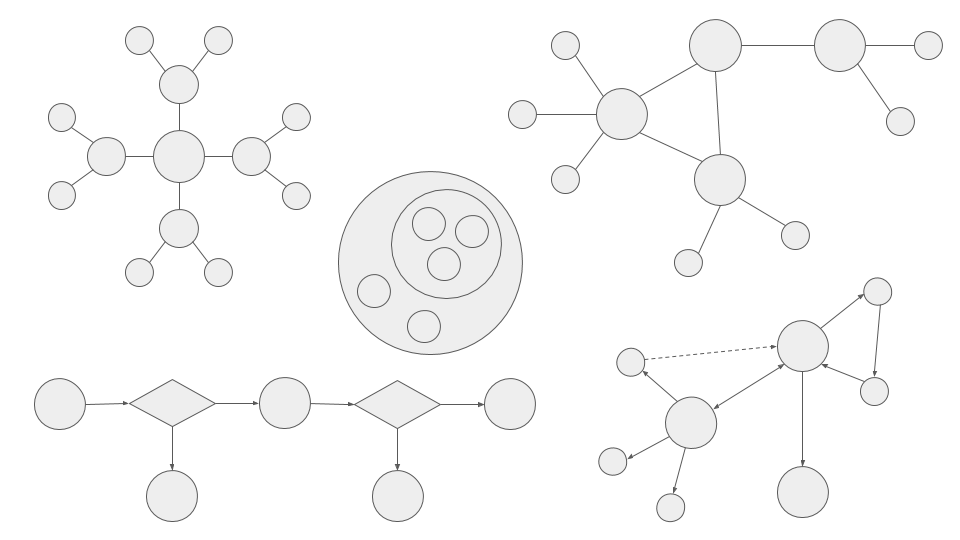
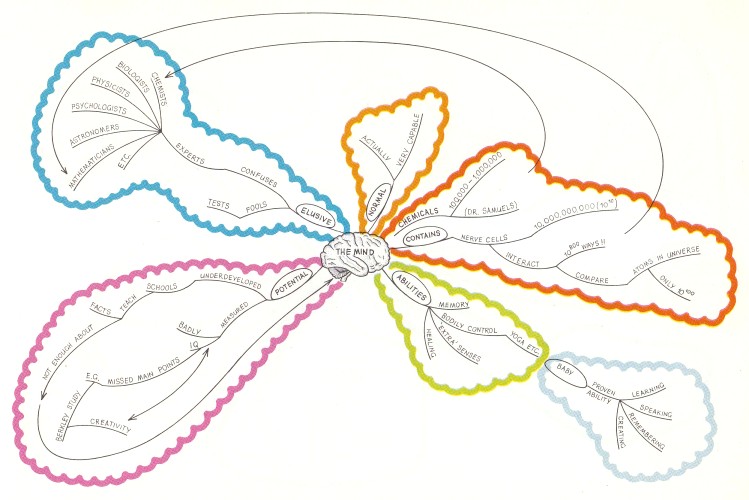
Radial maps. These, which include traditional mind maps, are a rudimentary form of thinking in maps. Starting from a central concept, the connected ideas expand outwards, in a radial manner. While radial maps offer a useful early exploration tool, the lack of interconnection between child nodes is one of the limitations of this approach.
Nested maps. Starting from a general concept and growing inwards, nested maps could be seen as the opposite of radial maps. Pretty rigid, nested maps make it hard to change the relationship between nodes.
Topic maps. More flexible than radial maps, topic maps allow for interlinking between topics without following a radial structure. They combine both associations between topics and occurrences of each topic.
Process maps. Also called flowcharts, process maps add directionality, with each concept connected in a specific order. They are powerful tools to think about procedures which involve multiple decisions, and are extremely common to represent information processing.
Concept maps. Developed by Professor Joseph D. Novak and his team at Cornell University in the 1970s as a tool to increase meaningful learning in science students, concept maps use a context frame instead of a specific starting point. The relationship between concepts can be articulated in linking phrases such as “contributes to”, “includes” or “shows”, and bi-directional links can be used to capture complex relationships between concepts with reciprocal interactions.
You may have noticed these maps use increasingly intricate systems to connect information and represent the relationships between pieces of knowledge. Are there any limitations to thinking in maps? How close exactly can such mental maps bring us to represent the complex thinking happening inside our minds?
The advent of the knowledge graph
One of the apparent limitations of thinking in maps is managing the sheer complexity—and intrinsic messiness—of our thought processes. It is extremely challenging to visually represent substantial volumes of dynamic ideas, all at different stages of formulation, with intricate bi-directional relationships. This is why all of the thinking maps we explored capture only a small subset of knowledge fixed at a specific point in time.
To address these challenges, let’s turn to one of the most ambitious areas of thinking—ambitious because it seeks answers to questions that may not have an answer: ontology. Ontology, the philosophical study of being, concerns itself with exploring the nature of becoming and existence, as well as the most fundamental categories of being and their relationships. Ontologies ask questions such as: “What is a thing? Into what categories, if any, can we sort existing things? What are the various modes of being of entities?”
While the first use of the term ontologia (from the Greek onto- i.e. “being”, and -logia i.e. “logical discourse”) seems to have appeared in 1606 in Ogdoas Scholastica by Jacob Lorhard, the earliest ontologies known to us can be traced back to ancient philosophers such as Plato and Aristotle, and also appear in Hindu philosophy as early as the first millennium BC, all exploring the fundamental nature of existence and the relationship between different categories of being.
Fast-forward to modern times, where every academic field uses ontologies to limit complexity and turn raw information into knowledge. In information science, an ontology is a formal representation and definition of the categories, properties and relationships between the concepts that make up an area of knowledge. These formal representations can have a profound impact on the way we think and the way we interact with the world. For instance, the modern web is built on the practical application of ontological principles, such as the standards set by the World Wide Web Consortium to create the Semantic Web and make Internet data machine-readable.
“I have a dream for the Web [in which computers] become capable of analyzing all the data on the Web – the content, links, and transactions between people and computers.” — Tim Berners-Lee.
Berners-Lee’s dream came closer to reality when Google launched its Knowledge Graph in 2012, enhancing its search engine’s results with relational information from a variety of sources. Today, Google’s Knowledge Graph has collected and connected billions of real-world or abstract concepts with almost no human intervention. If they are used to map something as complex as the modern Web, can such graphs be used to map complex and dynamic knowledge?
Indeed, knowledge graphs, used as a way to formally represent the meaning of information by describing concepts, categories, and relationships between concepts, appear to be one of the most established and most efficient modern ontology visualisation methods.
“While the indented tree visualisation is more organised and familiar to novice users, subjects found the graph visualisation to be more controllable and intuitive without visual redundancy, particularly for ontologies with multiple inheritance,” write Fu et al. in a 2013 study looking at the popularity and effectiveness of common techniques used by practitioners to visualise ontological data.
The integration of such inheritances and interconnections is what makes bi-directional knowledge graphs more powerful than simple trees and other radial maps when it comes to capturing dynamic knowledge—which is why they can be used to capture complex thought processes as well.
In a visionary essay anticipating many aspects of today’s information society, Dr. Vannevar Bush, then Director of the Office of Scientific Research and Development in the United States, imagined a memory machine allowing individuals to record, connect, and retrieve their knowledge.
“Consider a future device (…) in which an individual stores all his books, records, and communications, and which is mechanised so that it may be consulted with exceeding speed and flexibility. It is an enlarged intimate supplement to his memory,” he writes in 1945, coining the term memex.
The concept of the memex influenced the early development of hypertext systems, eventually leading to the creation of the Internet as we know it today—the biggest collective knowledge management system ever built. However, for almost 75 years, a true personal knowledge management system, creating the benefits envisioned by Dr. Vannevar Bush, seemed like a distant dream.
This has all changed in the past few years, with a renaissance in knowledge management software, including the likes of Notion (founded in 2018) and, more recently, Roam (founded in 2019). Both make use of flexible formulas to connect and retrieve information. Roam, in particular, offers both automated bi-directional linking and a visual knowledge graph for users to organically explore.
While Notion databases may feel more akin to radial maps or nested maps because of the product’s hierarchical approach to information, Roam databases feel closer to concept maps, where the context frame encompasses all of a user’s knowledge. The early success of these new metacognition tools has inspired the creation of many alternatives, each with its own parti-pris in terms of how knowledge should be connected and represented, effectively shaping varying worldviews for their users.
Whichever model prevails in the knowledge management quest, the next logical step seems to be the metamodeling of thinking in maps—a model made of a new language, a new schema for the semantic data constituting our thought processes. Or—as Conor White-Sullivan, the founder of Roam, puts it—a collection of algorithms of thought.
If I were to name this metamodel of thinking in maps—or the general study and practice of thinking in maps—I would call it “noegraphy”, from νόος (noûs, “mind”) and γράφω (gráphō, “write”). One can only guess what format and medium this metamodel will employ, but one day the tools we use will catch up with the way our minds think in maps, enabling a revolution in collective intelligence.